Lihat juga

 10.03.2026 04:32 AM
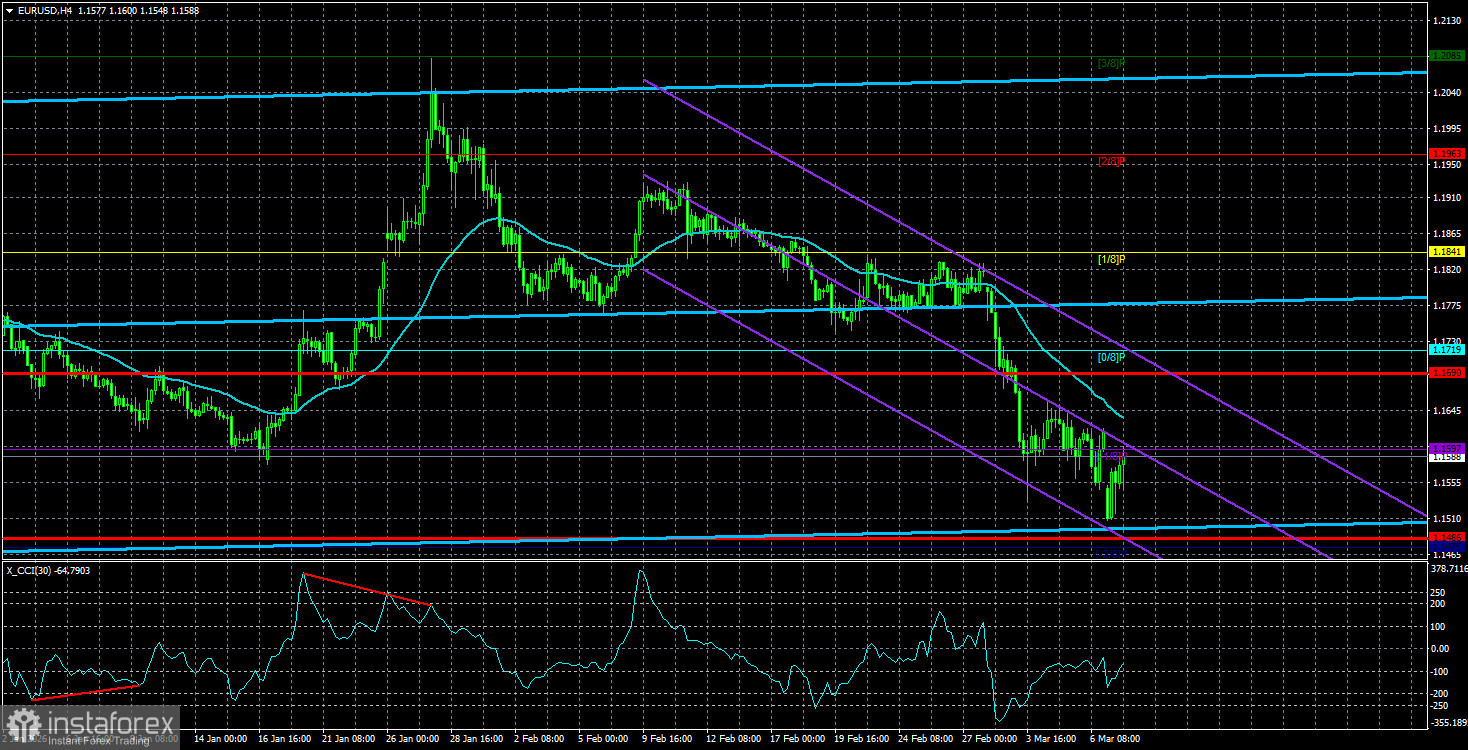
The EUR/USD currency pair experienced a new shock on Monday. To be precise, investors, traders, banks, companies, and governments—essentially, the entire world—suffered this shock. Brent oil prices soared to $119 per barrel in morning trading due to a series of attacks on refineries, storage facilities, and distribution sites. As we can see, the conflict in the Persian Gulf is focused on destroying energy infrastructure, which is its peculiarity.
Let's remember that Donald Trump initiated a full-scale war aimed at dismantling Iran's uranium stockpiles and preventing Tehran from hypothetically launching ballistic missile strikes against U.S. territory. Simultaneously, Trump hopes to bring about a change in the Iranian government to one more favorable to the U.S., as the U.S. president understands that any subsequent government will adhere to the same policies as its predecessor. Over the past week, approximately 50 high-ranking officials in Iran have been killed, including Ali Khamenei, the Supreme Leader. Yet Iran's policy has not changed at all.
However, currently, U.S. allies are not focused on destroying uranium stockpiles. They are targeting oil reserves, specifically production capacities in the oil sector. This raises a simple and painfully familiar question: Is the main goal actually oil rather than uranium? America is ready to share its oil and gas reserves with the world. However, last year, many countries had to be coerced into purchasing American oil and gas. Now, with many oil infrastructure facilities in the Middle East destroyed, the Strait of Hormuz blocked, and oil supplies from the region halted, oil prices have skyrocketed. So, who benefits from this situation? Those countries that produce oil and sell it, namely the U.S., Russia, and Washington-controlled Venezuela.
Of course, it is quite difficult to understand what Trump is really trying to achieve. It is entirely possible that the war in Iran is not only about the Iranian nuclear threat or oil, which is currently afloat. The main importer of oil from Venezuela and Iran has always been China. Perhaps the essence of the conflict lies within China? It is quite possible that Trump is, in a rather convoluted way, trying to stifle Beijing's industrial progress and economic growth, which he sees as the main enemy of the U.S. But what's the point if China can easily purchase oil and gas from Russia?
In general, there is always a narrative for the masses and a true narrative. Very few people on the planet know the truth, while the rest can only speculate. Nevertheless, the dollar has been rising much more slowly in recent days and is practically not rising at all. This suggests the market has already reacted to the war in the Middle East to a significant extent.
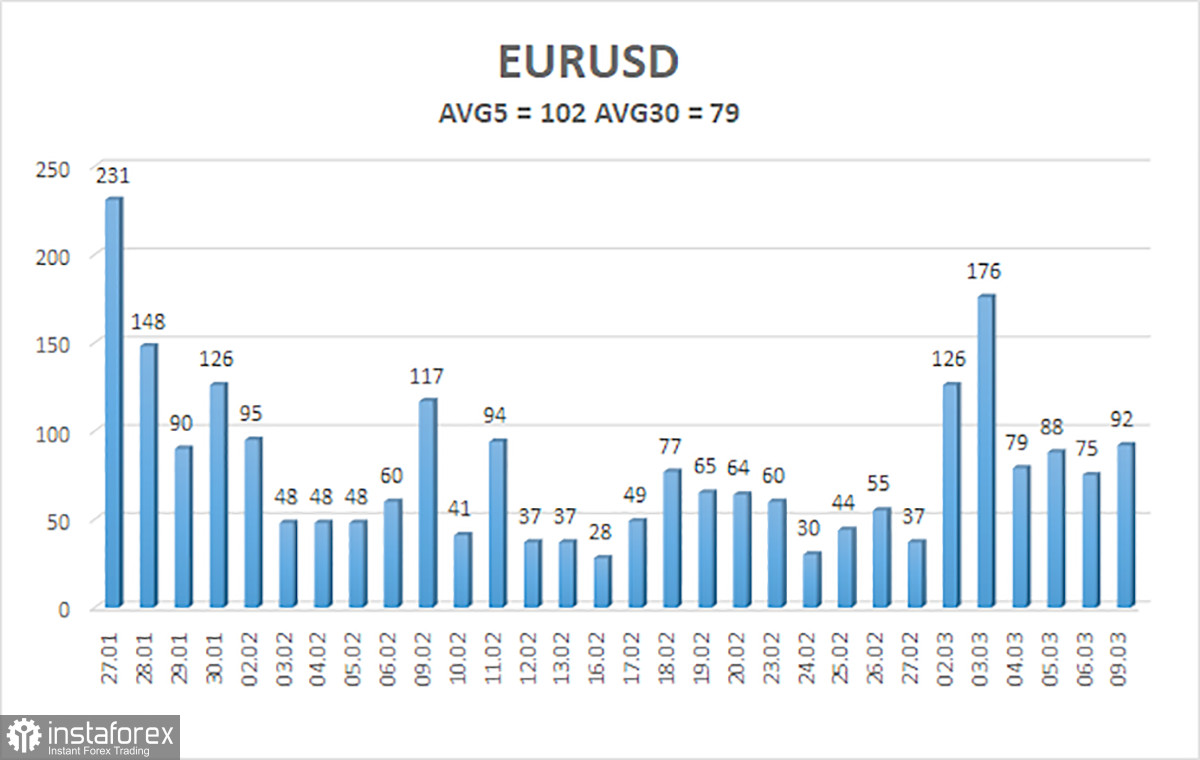
The average volatility of the EUR/USD currency pair over the past 5 trading days as of March 10 is 102 pips and is characterized as "high." We expect the pair to move between levels 1.1486 and 1.1690 on Tuesday. The upper linear regression channel points upward, indicating the upward trend is maintained. The CCI indicator has re-entered oversold territory, signaling a possible resumption of the upward trend. A new bullish divergence has also formed.
The EUR/USD pair continues its correction within the upward trend. The global fundamental background remains very negative for the dollar. The pair spent seven months in a sideways channel, and it is likely now time to resume the global trend of 2025. There is no fundamental basis for the dollar's long-term growth. We are currently witnessing another global correction. If the price is below the moving average, small shorts can be considered with targets at 1.1486 and 1.1475 based on technical (correction) grounds and influenced by the complex situation in the Middle East. Above the moving average line, long positions remain valid with targets at 1.1963 and 1.2085.
Linear regression channels help determine the current trend. If both are pointing in the same direction, it indicates a strong trend.
The moving average line (settings: 20.0, smoothed) indicates the short-term trend and the direction in which trading should currently proceed.
Murray levels – target levels for movements and corrections.
Volatility levels (red lines) – the probable price channel in which the pair will trade over the next 24 hours based on current volatility indicators.
The CCI indicator – its entry into the oversold territory (below -250) or overbought territory (above +250) indicates that a trend reversal in the opposite direction is approaching.


