
Veja também


 23.10.2026 08:57 AM
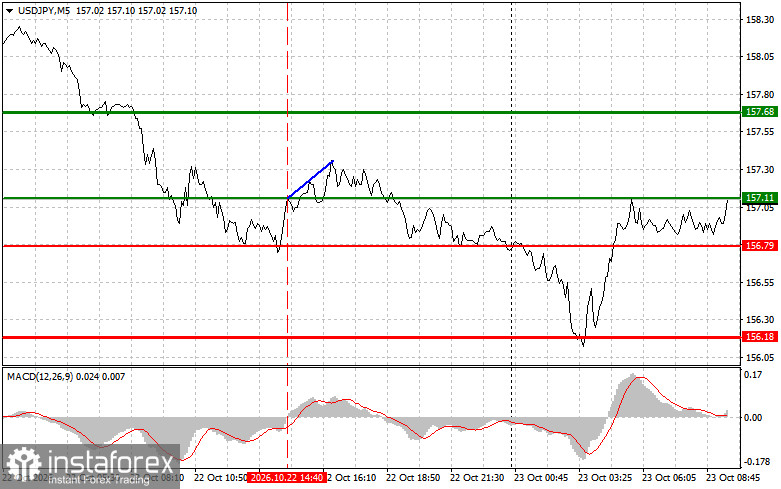
The price test at 157.11 occurred as the MACD indicator began moving up from the zero line, confirming a valid entry point to buy the dollar. As a result, the pair rose by 25 pips.
Yesterday the yen strengthened against the dollar despite not-bad U.S. data. The market saw initial jobless claims at 194,000 versus a forecast of 200,000. Continuing claims were 1,728,000 versus an expected 1,720,000. Normally that mix would support the dollar by increasing expectations of Federal Reserve tightening and pushing U.S. Treasury yields higher. However, a joint Japan-U.S. intervention—not officially confirmed, but one that moved the FX market similarly on July 31 and in September this year—led to yen strength.
Today's Japanese data gave the yen additional arguments. The consumer-price index for September rose to 2.1% from 1.9% previously, and the core index excluding fresh food was 2.1%, matching the forecast and accelerating from 1.8%. For the Bank of Japan, this is an important signal because inflation is clearly holding above the 2% target, which strengthens the case for further rate hikes (the current rate is 1.25%). Recall that Ueda on October 6 confirmed that rate increases would continue, and on October 15 board member Junko Koeda said the neutral rate is noticeably above 1%. The market currently prices roughly a 25% probability of a hike at the October 30 meeting, and today's figures could nudge that probability higher.
The picture on business activity is mixed. The manufacturing PMI for October was 53.3 versus a 54.5 forecast and 54.1 a month earlier — a disappointment — while the services PMI rose to 52.0 from 51.3 and the composite index remained at 52.3. Readings above 50 indicate expansion, so the Japanese economy continues to grow even as industry cools. I believe these figures, combined with rising inflation, will not allow the yen to weaken significantly, and while the risk of intervention hangs over the pair, USD/JPY will struggle to hold above recent highs. I therefore treat any attempts at further gains with caution.
For the intraday strategy, I will rely more on Scenarios No. 1 and No. 2.
Scenario No. 1: I plan to buy USD/JPY today when it reaches an entry point around 157.15 (the green line on the chart), targeting 157.68 (the thicker green line on the chart). Around 157.68, I intend to exit long positions and open short positions in the opposite direction (expecting a 30–35-pip move away from that level). It is best to return to buying the pair on corrections and significant pullbacks in USD/JPY. Important! Before buying, make sure the MACD indicator is above the zero line and is just beginning to rise from it.
Scenario No. 2: I also plan to buy USD/JPY today in the event of two consecutive tests of 156.84 when the MACD indicator is in the oversold area. This will limit the pair's downside potential and lead to an upward reversal. One can expect a rise to the opposite levels of 157.15 and 157.68.
Scenario No. 1: I plan to sell USD/JPY today only after 156.84 is refreshed (red line on the chart), which will lead to a rapid decline of the pair. Sellers' key target is 156.18, where I intend to exit shorts and immediately open longs in the opposite direction (expecting a 20–25-pip move away from that level). Sellers will return at any moment — only a hint from the central bank is needed. Important! Before selling, make sure the MACD indicator is below the zero line and is just beginning to decline from it.
Scenario No. 2: I also plan to sell USD/JPY today in the event of two consecutive tests of 157.15 when the MACD indicator is in the overbought area. This will limit the pair's upside potential and lead to a downward reversal. One can expect a decline to the opposite levels of 156.84 and 156.18.
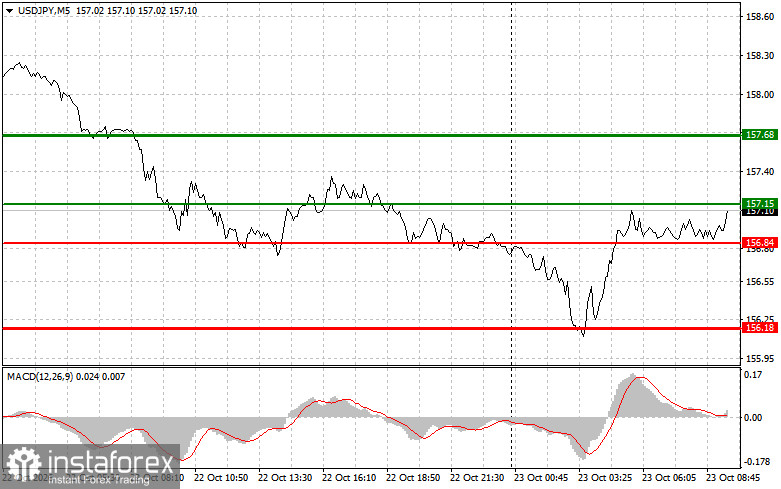
Thin green line — entry price where you can buy the instrument.
Thick green line — approximate price where you can place Take Profit or manually lock in profits, because further upside above this level is unlikely.
Thin red line — entry price where you can sell the instrument.
Thick red line — approximate price where you can place Take Profit or manually lock in profits, because further downside below this level is unlikely.
MACD indicator. When entering the market, it's important to consider overbought and oversold zones.
Important. Novice Forex traders must be very cautious when deciding to enter the market. It is best to stay out before major fundamental reports to avoid getting caught in sharp price swings. If you decide to trade during news releases, always place stop orders to minimize losses. Without stop orders, you can quickly lose your entire deposit, especially if you don't use money management and trade large volumes.
Remember: successful trading requires a clear trading plan, like the example above. Spontaneous trade decisions based solely on the immediate market situation are, by definition, a losing strategy for an intraday trader.


