Vea también

 21.04.2026 06:52 AM
The situation in the cryptocurrency market remains unchanged. Over the weekend, Bitcoin experienced a slight decline amid worsening conditions in the Middle East; however, it continues to trade within an upward correction amid a downward trend that has persisted for more than two months. This is the fact we should focus on now. Since the upward trend on the 4-hour timeframe has not been broken, the correction may continue. The consolidation on the 4-hour timeframe can be considered complete, while on the daily timeframe, Bitcoin has not yet reached the nearest point of interest (POI). Thus, even if we see a resumption of the downward trend right now, there are currently no entry points for positions. If the upward trend on the 4-hour timeframe is broken, then we can consider "bearish" patterns in hopes of a new round of the downward trend.
In the meantime, an increasing number of crypto analysts are beginning to doubt that the current rise of "digital gold" marks the start of a new bullish trend. More analysts believe that the current rise in Bitcoin is a trap for bulls rather than a sustainable trend. Some point out that the current phase of the cycle closely resembles a distribution phase, which is intended to push retail traders out of the market. Recall that according to Wyckoff's methodology, any consolidation is either a distribution or an accumulation. After any consolidation, a trend begins. However, in our case, the upward movement over the last two months shows all the signs of a correction. Therefore, this could indeed be a distribution phase preceding a new prolonged decline of the leading cryptocurrency. To reiterate: we are not against a bullish trend, but there are still no signs of its beginning.
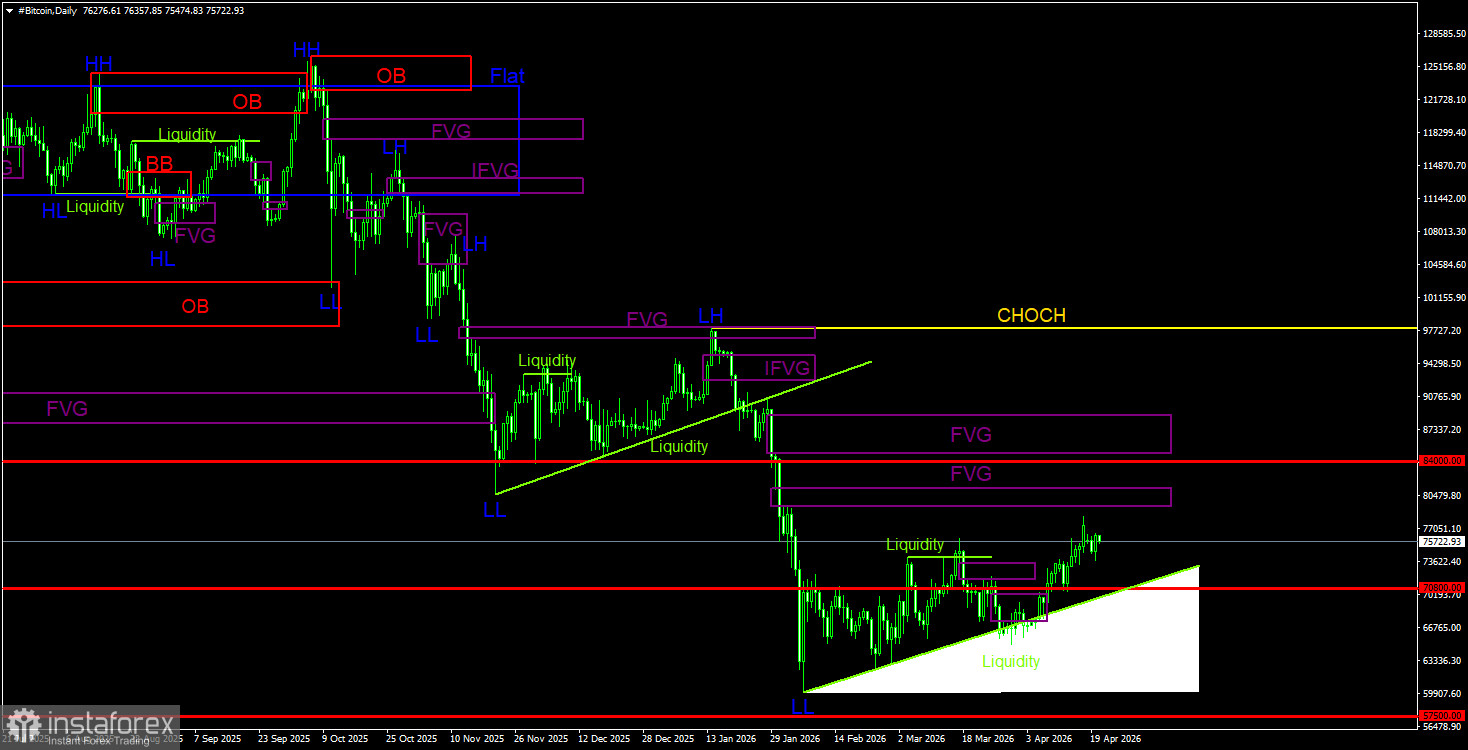
On the daily timeframe, Bitcoin continues to form a downward trend. The trend structure is bearish, and the CHOCH line remains at $97,900. Only above this level can we consider the downward trend to be over. Given no signs of an upward trend, we believe the decline will resume. On the daily timeframe, the nearest area of interest for new short positions is between $79,500 and $81,100. A sell signal may be formed in this area, but any signal requires confirmation on a timeframe two stages lower—meaning, in our case, on the hourly timeframe. It is preferable that this be a break in the upward structure. The liquidity pool below the trend line remains the target for the price.
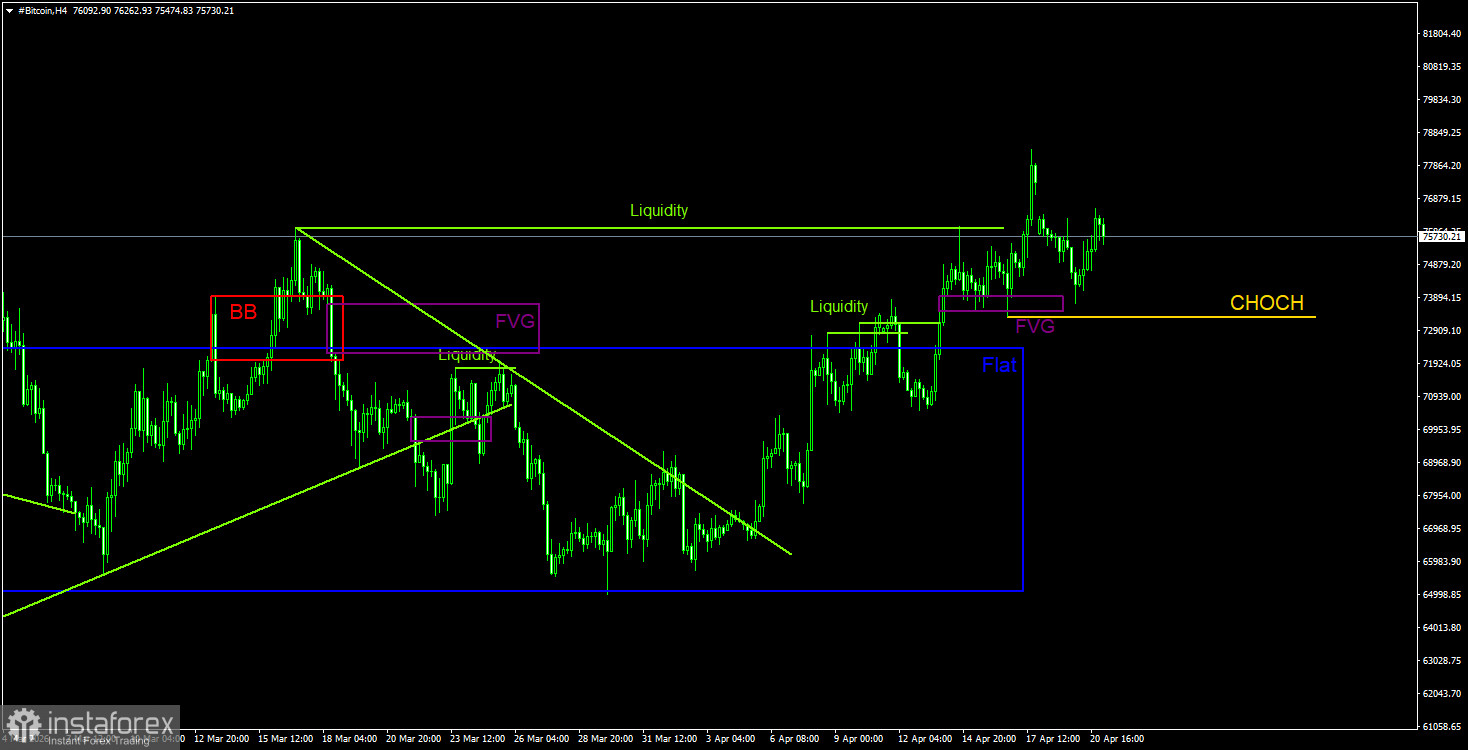
On the 4-hour timeframe, the price has continued to form an upward trend for three weeks. The nature of the cryptocurrency's movement remains maximally unattractive but quite typical for a correction. Until recently, it was unclear whether Bitcoin was in a consolidation, so only the last signal from the bullish FVG could be acted on after the price had already left the channel. However, further growth is now in question as the price approaches a bearish FVG on the daily timeframe. Overcoming the CHOCH line will indicate a break of the current upward trend, which could serve as a starting point for a downward trend that may in turn, mark the beginning of a new wave on the daily timeframe.
Bitcoin continues to form a full-fledged downward trend and a correction against it. We continue to anticipate a decline, targeting $57,500 (the 61.8% level according to Fibonacci from a three-year upward trend), with no signs of a trend reversal at this time. However, even the $57,500 level does not appear to be a final stop. Among the areas of interest at this time, the nearest bearish FVG on the daily timeframe is noted at $79,300 - $81,200. On the 4-hour timeframe, local bullish patterns can be used for long positions, but it should be remembered that patterns on the daily timeframe are more important, and the correction has already been prolonged. On the 4-hour timeframe, we would recommend waiting for a break of the structure and then for the formation of bearish patterns and signals.


