See also

 10.06.2026 07:16 PM
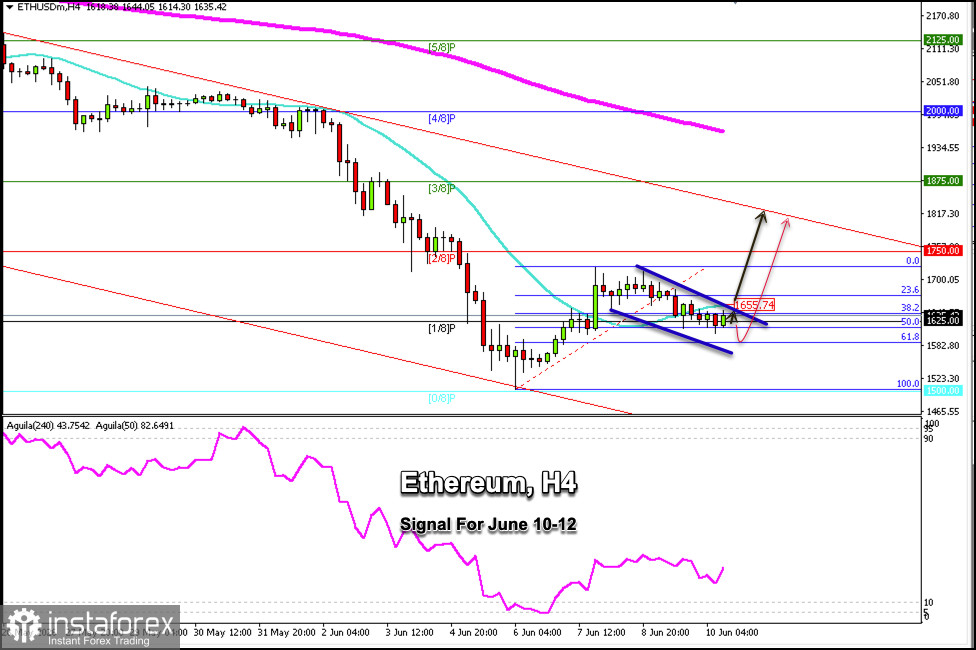
Ethereum (ETH/USD) is trading around $1,635, bouncing after reaching the 50% Fibonacci retracement level drawn from its low of $1,500 to its high of $1,725. Ethereum may struggle to continue its upward trend, and we could expect a further downward movement in the coming days, potentially reaching the 61.8% Fibonacci level around $1,590.
Given the prevailing bearish pressure, Ethereum is expected to return to the $1,500 level, a key level that could be seen as a decisive point for entering long positions. Alternatively, if the ETH price breaks above the 61.8% Fibonacci level, it could be viewed as a bullish signal.
Conversely, if Ethereum consolidates above the 21-period SMA at $1,655 in the coming hours, we could expect the bullish cycle to resume, potentially reaching the 2/8 Murray level around $1,750 and even the upper band of the descending trend channel around $1,785.
Ethereum could recover some of its losses if it consolidates above $1,650 in the coming days, potentially reaching the 200-period EMA around $1,925. Given that all cryptocurrencies are currently under bearish pressure, we could look for opportunities to sell below $1,655, with targets at $1,580 and ultimately around the 0/8 Murray level at $1,500.
You have already liked this post today
*The market analysis posted here is meant to increase your awareness, but not to give instructions to make a trade.


