यह भी देखें

 08.12.2025 09:33 AM
Bitcoin continues to correct. The technical picture at this time is clear, but yesterday's pattern somewhat complicates the situation. This refers to the "bearish" FVG on the daily timeframe, which contradicts the technical picture on the 4-hour timeframe and all existing patterns. Therefore, I had to refer to Bitcoin's "closest relative" – Ethereum, to clarify the situation. No similar pattern emerged for Ethereum, and on the 4-hour Bitcoin chart, the picture is more than telling. Thus, we conclude that the 4-hour chart is more relevant at this time, considering the corrective status of the movement.
On the 4-hour timeframe, the pair worked off the nearest "bullish" IFVG (identical to Ethereum) and cleared liquidity (similarly to Ethereum). Therefore, both major cryptocurrencies formed absolutely identical buy signals. Recall that any growth at this time is a correction on the higher timeframe. However, if you are trading short-term, such signals can certainly be worked off. Just keep their corrective status in mind and don't expect a super-strong movement. In the near future, we can expect growth above $94,000. Meanwhile, at $97,000, a "bearish" FVG on the daily timeframe begins, which currently represents the only area of interest (POI) for selling.
Regarding fundamental reasons for a further decline in Bitcoin, there are none, and none are needed. This week will see the FOMC meeting, during which there is a 99% chance of a rate cut, which could theoretically support the entire cryptocurrency market. However, do remember that the market has been pricing in Federal Reserve easing for three years. We believe all the "bullish" factors have long been priced in.
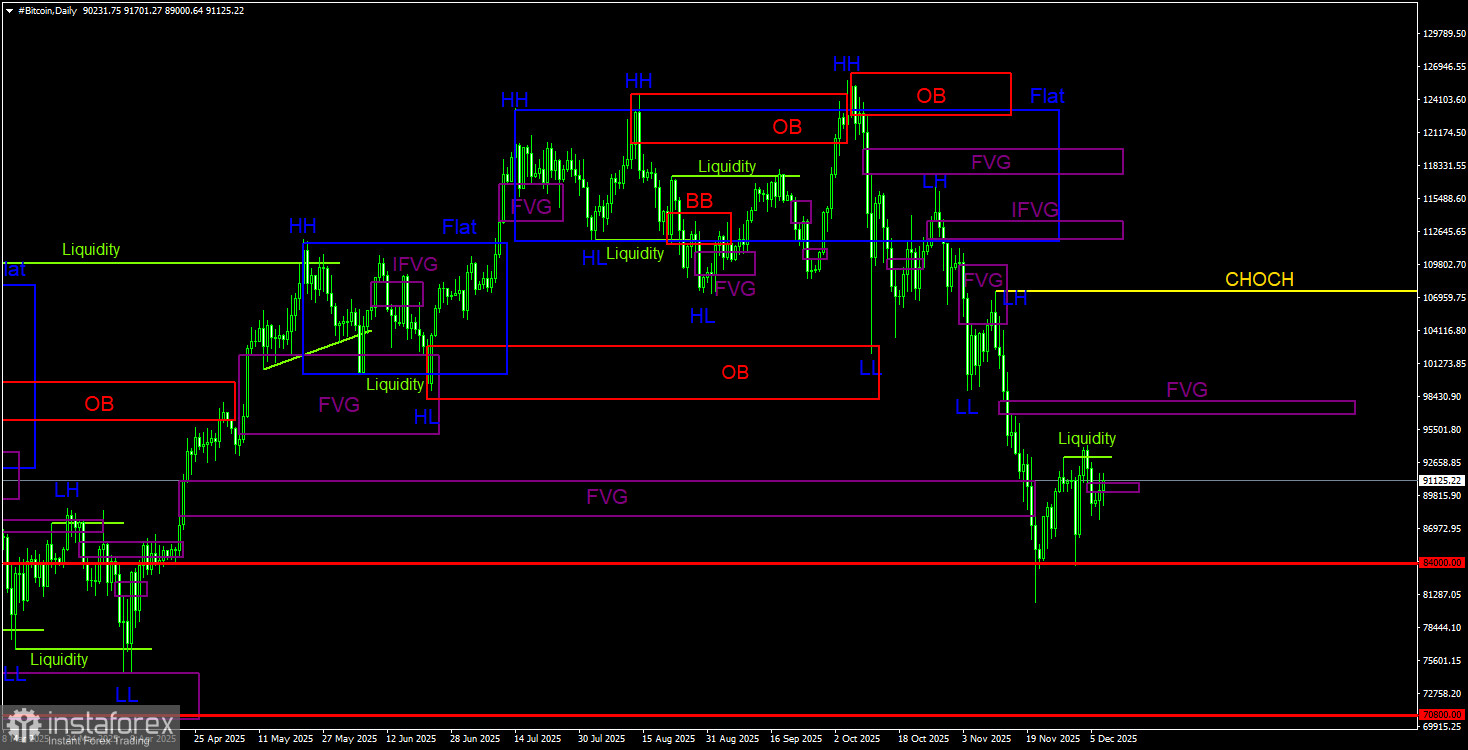
On the daily timeframe, Bitcoin continues to form a downward trend but is currently correcting. The trend structure is identified as downward, with the bullish OB from June having been cleared and the April bullish FVG breached, along with the $84,000 (38.2% Fibonacci) level, which we highlighted as a target. Bitcoin can fall all the way to $60,000, from where its last ascent began. During the last leg of the decline, a small bearish FVG was created, which now serves as the only area of interest (POI) for new sales.
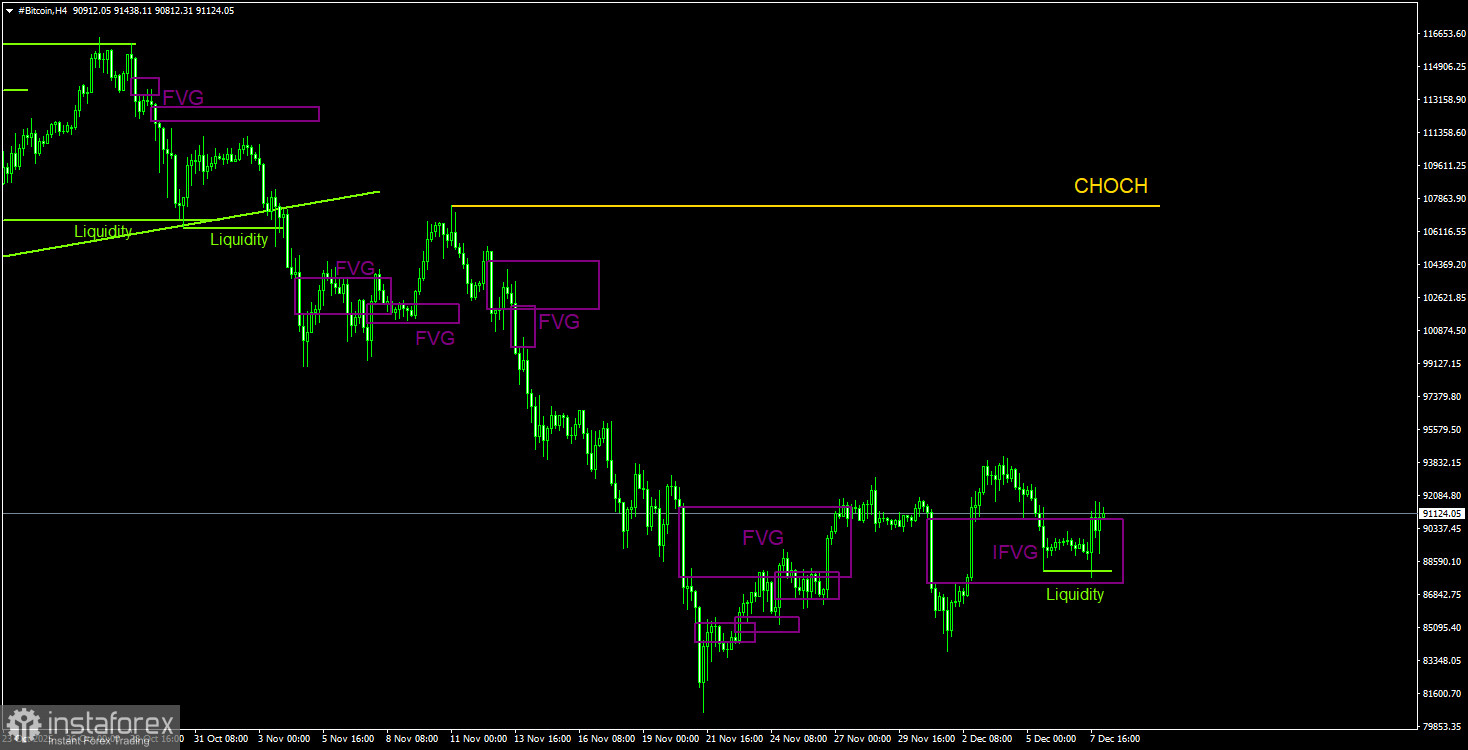
On the 4-hour timeframe, the technical picture clearly indicates a downward trend. The CHOCH (change of character) line runs at $107,400, and only above this level can the trend be considered complete. Until that time, the market's bearish sentiment remains intact in the short term. The last bullish IFVG has been worked off and has reacted. Thus, we anticipate continued growth in the coming days, especially since there are currently no new short positions to open based on the trend. A return to the daily FVG level is necessary.
Bitcoin has broken the upward structure on the daily timeframe and is forming a full-fledged downward trend for the first time in three years. The two nearest targets (bullish OB in the range of $98,000–$102,700 and bullish FVG) have been worked off, and we should now expect a decline to $70,800 (the 50.0% Fibonacci level from the three-year upward trend). In the near future, we may observe a correction, so it is advisable to seek new selling opportunities. The only area of interest for selling is the nearest bearish FVG on the daily timeframe, located in the range of $96,800 – $98,000.

