यह भी देखें

 21.01.2026 10:51 AM
The EUR/USD pair continued its upward movement on Tuesday and reached the 23.6% corrective level at 1.1731 by the end of the day. A rebound from this level would work in favor of the U.S. dollar and a modest decline toward the Fibonacci levels of 38.2% and 50.0%. A consolidation above the 1.1731 level would increase the likelihood of continued growth toward the resistance level of 1.1802–1.1805.
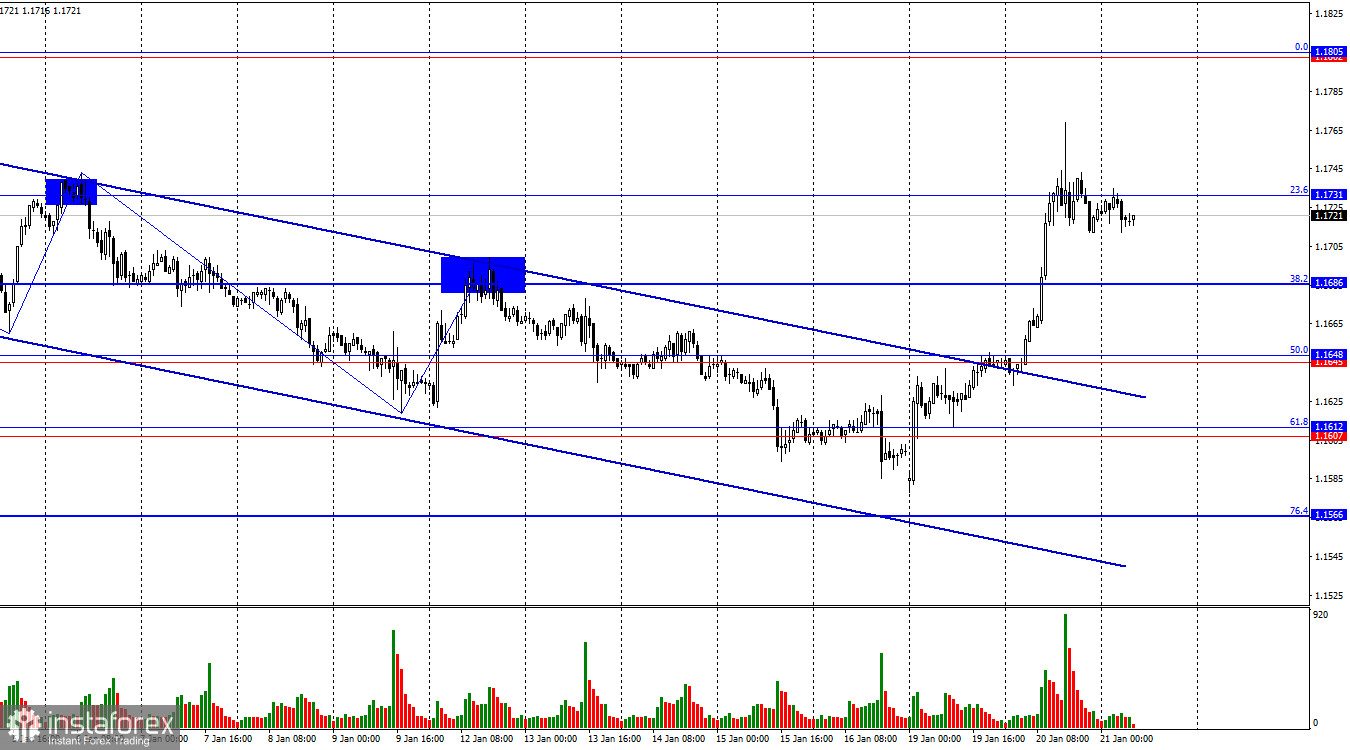
The wave situation on the hourly chart remains straightforward. The last completed downward wave broke the low of the previous wave, while the new upward wave broke the previous peak. Thus, the trend has once again shifted to "bullish." The bulls are launching a new offensive, which might not have happened without Donald Trump. However, Trump continues to escalate tensions around Greenland, and the markets are responding by fleeing from the risky U.S. currency with uncertain economic prospects.
On Tuesday, traders continued to price in the events of the weekend and Monday. Let me remind you that Donald Trump announced the introduction of new trade tariffs on certain European Union countries that are particularly vocal in supporting the preservation of Denmark's territorial integrity. The tariffs will come into force in 10 days. Today marks the start of the World Economic Forum in Davos, where Trump will hold a meeting with European leaders to discuss the situation around Greenland. However, almost all experts do not expect a de-escalation of the geopolitical conflict. On the contrary, Trump is likely to continue insisting on the sale of Greenland to the United States and threatening a military seizure of the island or new trade tariffs. Europe has no choice but to respond in kind: tariffs, sanctions, restrictions. As a result, already at the beginning of 2026, the trade war between the U.S. and the EU may not only resume but also expand. Since Donald Trump is the "main culprit," and the new tariffs will also hit the U.S. economy, the market has quite reasonably resumed selling the dollar. In my view, the dollar's prospects for 2026 have shifted from "foggy" to "depressing."
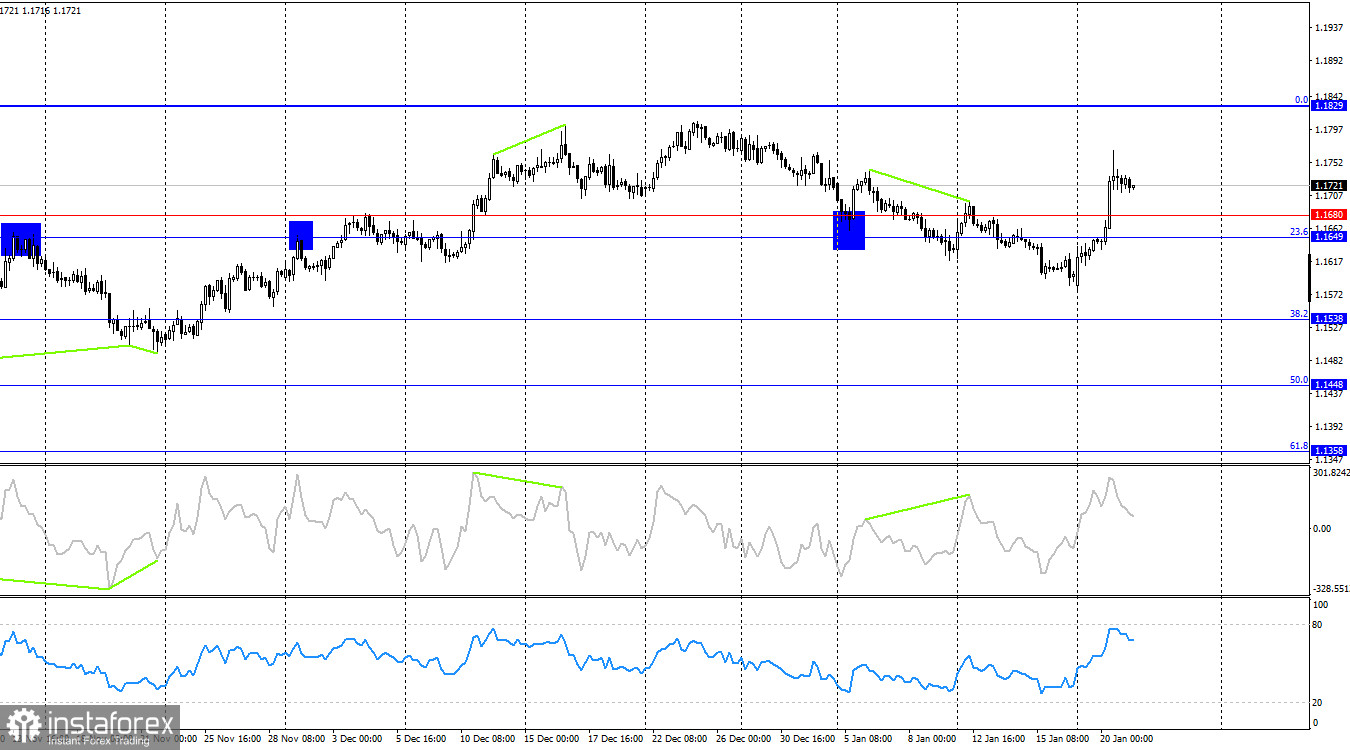
On the 4-hour chart, the pair has reversed in favor of the European currency and consolidated above the 1.1649–1.1680 level. Thus, the growth process may continue toward the next Fibonacci level of 0.0% — 1.1829. Another close below the 1.1649–1.1680 level would favor the U.S. dollar, but it is quite difficult to imagine dollar growth under the current circumstances. No emerging divergences are observed today on any indicator.
Commitments of Traders (COT) Report:
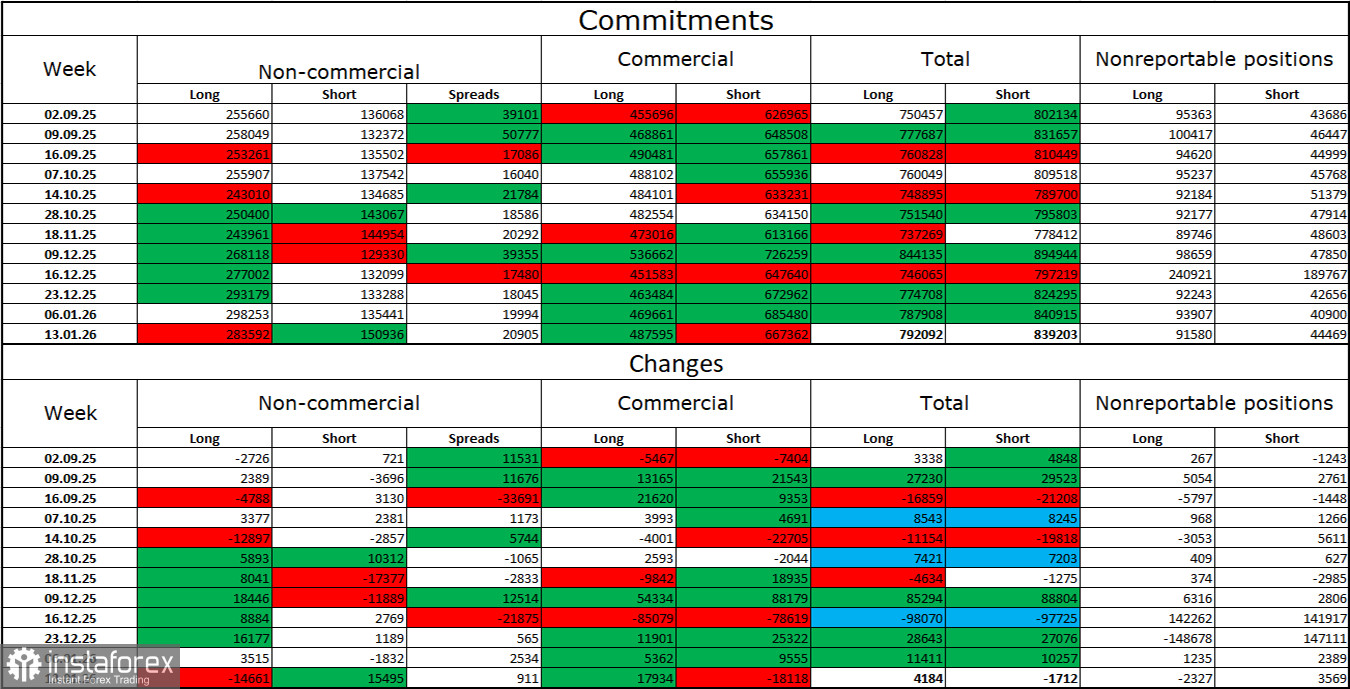
During the last reporting week, professional players closed 14,661 long positions and opened 15,495 short positions. The sentiment of the "Non-commercial" group remains bullish thanks to Donald Trump and his policies, and it continues to strengthen over time. The total number of long positions held by speculators now stands at 283 thousand, while short positions amount to 151 thousand. This represents nearly a twofold advantage for the bulls.
For thirty-three consecutive weeks, large players were reducing short positions and increasing long ones. Then the "shutdown" began, and now we are seeing the same picture again: professional traders continue to build up long positions. Donald Trump's policies remain the most significant factor for traders, as they create numerous problems that will have long-term and structural consequences for the United States. For example, the deterioration of the labor market. Traders fear a loss of Federal Reserve independence in 2026 under pressure from Trump and against the backdrop of Jerome Powell's resignation.
News Calendar for the U.S. and the European Union:
European Union – Speech by ECB President Christine Lagarde (07:30 UTC).
On January 21, the economic calendar contains only one entry. The impact of the news background on market sentiment on Wednesday may be weak.
EUR/USD Forecast and Trading Advice:
Selling the pair is possible today in the event of a rebound from the 1.1731 level on the hourly chart, with targets at 1.1686 and 1.1648. Buying opportunities emerged after a consolidation above the descending channel and the resistance level of 1.1645–1.1648 on the hourly chart, with targets at 1.1686 and 1.1731. Both targets have been reached. A consolidation above the 1.1731 level would allow traders to maintain long positions with a target at 1.1802.
Fibonacci grids are drawn from 1.1492–1.1805 on the hourly chart and from 1.1066–1.1829 on the 4-hour chart.

