यह भी देखें

 17.02.2026 04:03 AM
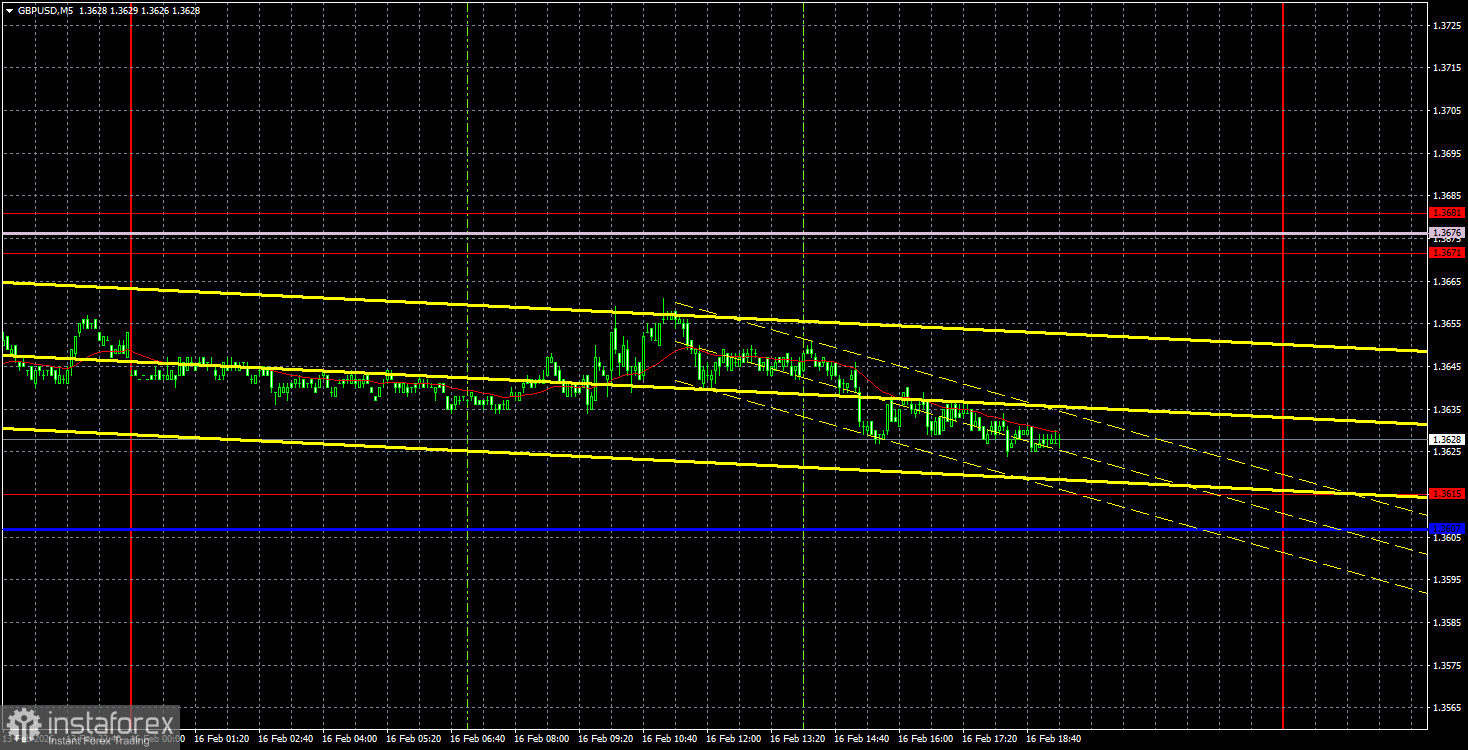
The GBP/USD currency pair traded within a sideways channel on the hourly timeframe throughout Monday. The price remains between two areas: 1.3607-1.3615 and 1.3671-1.3681. Thus, a bounce from one area leads to movement toward the opposite area. This is what traders can capitalize on in the coming days. Trend movement will resume when the price exits the sideways channel.
Yesterday, on Monday, there were no significant events or reports in the UK or the U.S. Thus, as we predicted, there was nothing for traders to react to. Volatility during the day was minimal. Today, there will be several important reports in the UK, but we shouldn't expect much from an exit out of the flat—traders managed to ignore much more important data from across the ocean last week.
On the 5-minute timeframe, no trading signals were formed on the first trading day of the week. The price did not even approach either boundary of the flat. Therefore, there were no grounds to enter the market.
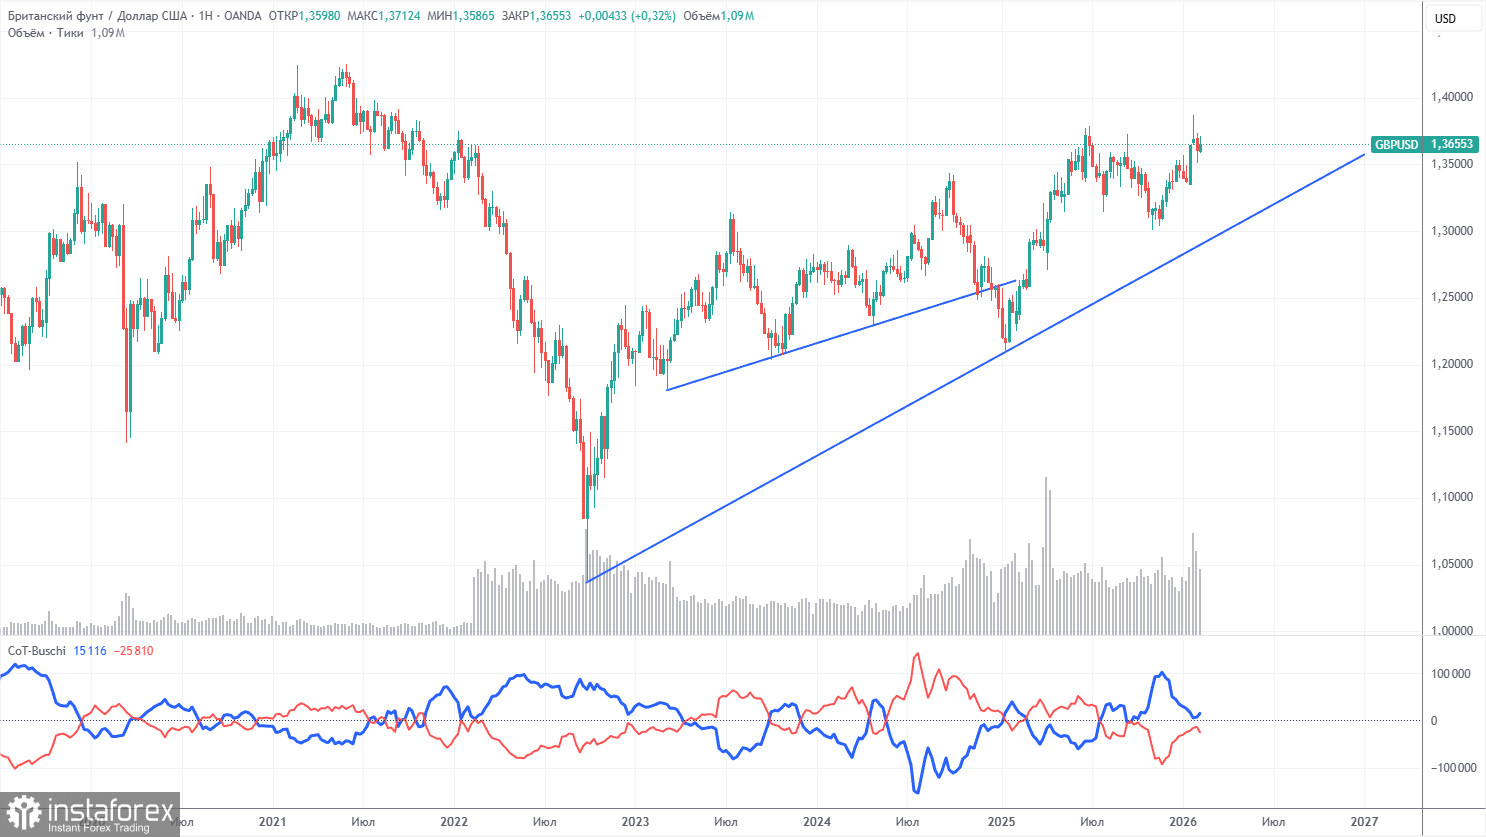
COT reports for the British pound indicate that, in recent years, commercial traders' sentiment has been changing frequently. The red and blue lines representing the net positions of commercial and non-commercial traders consistently cross and are often near the zero mark. Currently, the lines are coming closer together, with non-commercial traders still dominating with... sales. Recently, speculators have been actively increasing long positions, so a change in sentiment may soon occur, which does not particularly affect the GBP/USD pair.
The dollar continues to decline due to Donald Trump's policies, as shown clearly on the weekly timeframe (illustration above). The trade war will continue in one form or another for a long time, and the Federal Reserve will, in any case, lower rates in the next 12 months. Demand for the dollar will inevitably fall. According to the latest COT report (as of February 10) for the British pound, the "Non-commercial" group closed 6,500 BUY contracts and opened 5,300 SELL contracts. Thus, the net position of non-commercial traders decreased by 11,800 contracts over the week.
In 2025, the pound rose significantly, but it should be understood that this was solely due to Trump's policies. Once this reason is neutralized, the dollar may start to rise. But when that will happen, no one knows.
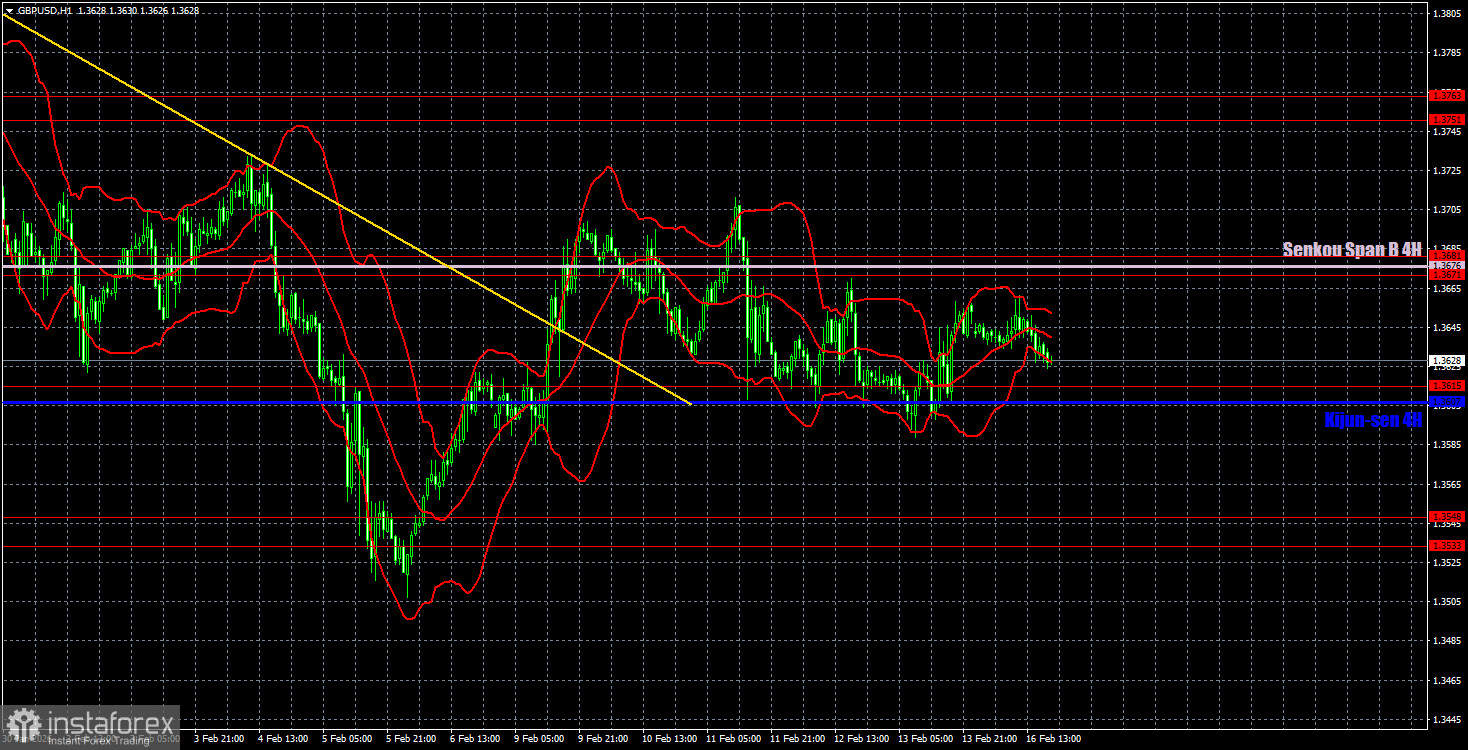
On the hourly timeframe, the GBP/USD pair has broken the downward trend, so a short-term rise is now expected. Certain events have recently been hindering the growth of the British currency or supporting the dollar. The market has simply ignored many data points. We still believe that, in the medium term, the British pound will rise amid a declining American currency. However, a flat has formed in the pair at this time.
For February 17, we highlight the following important levels: 1.3201-1.3212, 1.3307, 1.3369-1.3377, 1.3437, 1.3533-1.3548, 1.3615, 1.3671-1.3681, 1.3751-1.3763, 1.3846-1.3886, 1.3948. The Senkou Span B line (1.3676) and the Kijun-sen line (1.3607) can also serve as sources of signals. A Stop Loss level is recommended to be set to breakeven once the price moves 20 pips in the correct direction. The lines of the Ichimoku indicator may move throughout the day, which should be taken into account when determining trading signals.
On Tuesday, the UK has scheduled reports on unemployment, unemployment claims, and wages. We do not consider these reports to be particularly influential on trader sentiment. The market remains flat, and even reports of this rank may not significantly affect the pair's intra-day movement. The U.S. macroeconomic calendar is empty.
Today, traders may consider short positions with a target of 1.3533-1.3548 if the price consolidates below the 1.3607-1.3615 range. Long positions will become relevant with a target of 1.3671-1.3681 if the price bounces from the 1.3607-1.3615 area.
Support and resistance levels – thick red lines around which movement may end. They are not sources of trading signals.
Kijun-sen and Senkou Span B lines – lines from the Ichimoku indicator transferred to the hourly timeframe from the 4-hour timeframe. They are strong lines.
Extreme levels – thin red lines from which the price has previously bounced. They are sources of trading signals.
Yellow lines – trend lines, trend channels, and any other technical patterns.
Indicator 1 on COT charts – the size of the net position of each category of traders.

