
यह भी देखें


 13.08.2026 04:15 AM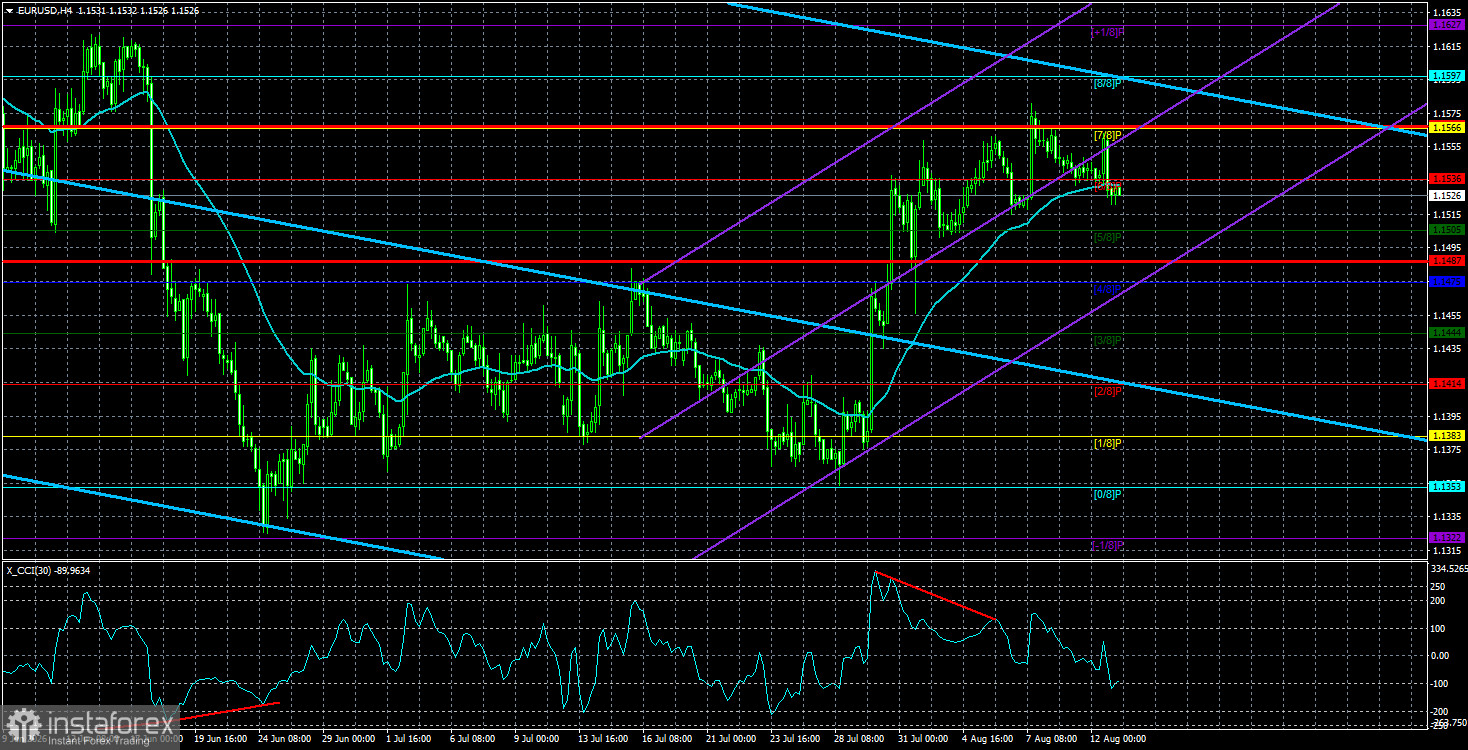
The EUR/USD currency pair again moved very sluggishly on Wednesday. One should understand that "sluggish" on Monday and Tuesday is not the same as "sluggish" on Wednesday. If, during the first two days of the week, the EUR/USD pair showed a total volatility of 46 pips, then on Wednesday this indicator increased noticeably. But did it increase enough to call the volatility "high"? No. Moreover, an important inflation report was published yesterday. Unfortunately, only its "headline" mattered, while the value itself was bland and ordinary. Therefore, the market's reaction to that report was restrained, but quite logical.
So, US inflation slowed in July from 3.5% to 3.4%, as forecast. Core inflation slowed from 2.6% to 2.5%, also as forecast. Consequently, this is one of those rare cases when market expectations fully coincided with reality. In essence, traders had nothing to react to because they expected exactly these figures in the report. Nevertheless, the US currency fell slightly, which is also quite logical. Inflation in the US is slowing for the second month in a row, which significantly reduces the probability of a "hawkish" Federal Reserve decision in September.
Recall that in June the market became convinced that Fed tightening was only a matter of time. Now it still holds that view, but has shifted the emphasis from September to the end of the year. In other words, the market still expects a Fed rate hike, but not in September — a little later. In our view, this information should be treated as expectations rather than as a forecast. If US inflation continues to slow (for any reason), the Fed will not tighten. If the US labor market continues to weaken, the Fed is very likely to refrain from tightening. If the conflict in the Middle East ends, inflation will decline. If Donald Trump again begins pressuring the Fed, some officials may shift to a more dovish stance. There are too many "ifs" to unconditionally believe in a rate hike by the end of the year.
At the moment, one thing can be said: there are no grounds for monetary tightening in September. Inflation is slowing, and the labor market has been weakening for the fourth month in a row. Thus, the dollar's decline is absolutely logical. We believe the US currency's fall should continue in any case, given the combination of geopolitical, macroeconomic, and fundamental factors. The market has already priced in the most hawkish scenario in advance and is now gradually losing faith in it. Also recall that Kevin Warsh is unlikely to be eager to raise the key rate, since he could come under heavy criticism from the White House. And Trump may start a fight against him, as he previously did with Lisa Cook or Jerome Powell. Warsh is unlikely to want to start a war with Trump at the very beginning of his term.
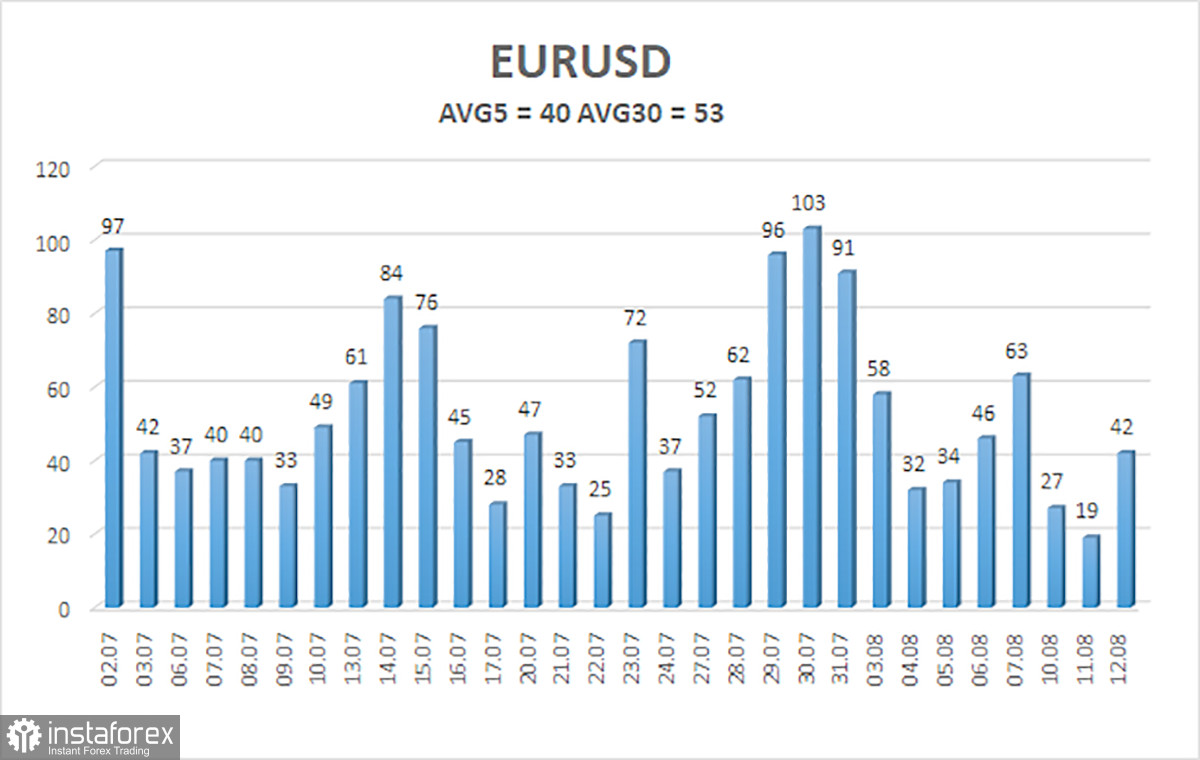
The average volatility of the EUR/USD pair over the last 5 trading days as of August 13 is 40 pips and is characterized as "low." We expect the pair to move between levels 1.1487 and 1.1567 on Thursday. The higher linear regression channel is directed downward, indicating the persistence of a downtrend. The CCI indicator entered the overbought area and formed a "bearish" divergence, which warns of a possible downward retracement.
S1 – 1.1505
S2 – 1.1475
S3 – 1.1444
R1 – 1.1536
R2 – 1.1566
R3 – 1.1597
The EUR/USD pair continues its upward trend on the 4-hour timeframe, which may mark the beginning of a new wave in a global uptrend on higher timeframes. The global fundamental backdrop for the dollar remains negative, but in 2026, first geopolitics and then the Fed's hawkish stance provided strong support to the US currency. However, every fairy tale comes to an end sooner or later. If the price is below the moving average, shorts can be considered, with targets at 1.1505 and 1.1487. Above the moving average line, long positions are relevant with targets of 1.1566 and 1.1597.
Linear regression channels help determine the current trend. If both are directed the same way, the trend is strong.
The moving average line (settings 20,0, smoothed) defines the short-term trend and the direction in which to trade now.
Murray levels are target levels for moves and corrections.
Volatility levels (red lines) indicate the likely price channel the pair will spend the next day in, based on current volatility indicators.
The CCI indicator — its entry into the oversold area (below -250) or the overbought area (above +250) means a trend reversal to the opposite side is approaching.

