
यह भी देखें


 01.09.2026 04:59 AM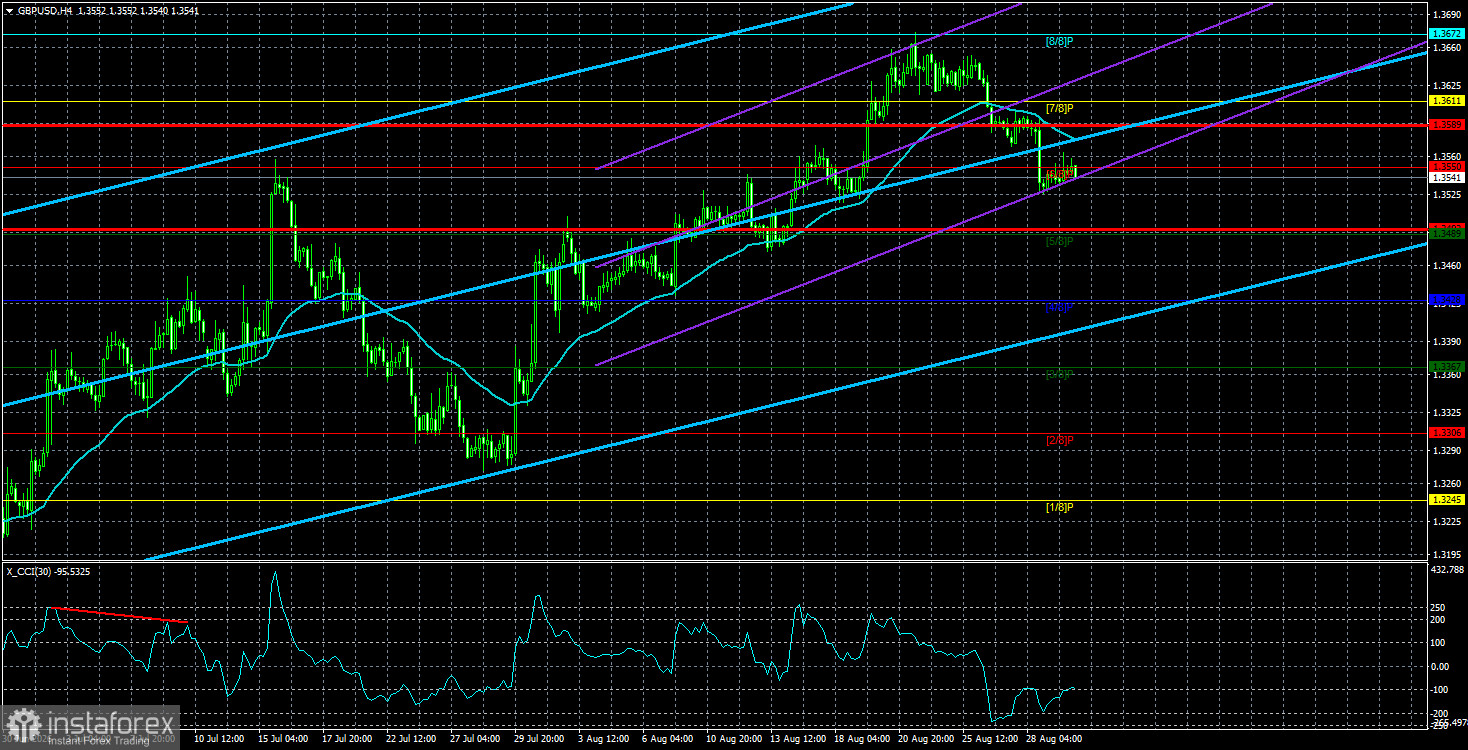
The GBP/USD pair traded very sluggishly on Monday, with overall daily volatility again being minuscule. The chart below clearly shows that volatility has remained low over the past three, or even four, weeks. Over the last five trading days, it has not exceeded an average of 50 pips. What are 50 pips a day for the historically volatile pound? It's the same as 30 pips for the euro currency. And 30 pips — that's practically complete calm in the market. Thus, just based on the volatility indicator, we can draw several important conclusions.
Firstly, the market is not ready for strong movements at this time. Secondly, it is only prepared to react to the most important events, such as the Nonfarm Payrolls, unemployment rate, consumer price index, Kevin Warsh's speech, and central bank meetings. All other events may provoke market reactions, but these will be minimal and considered secondary. Therefore, this week, about 80% of the prospects for the EUR/USD and GBP/USD currency pairs will once again depend on the Nonfarm Payrolls indicator, but this time only for August. In our view, the August report will hold much more significance than the annual report published last Friday. It may seem that the annual report is more important, but Friday's report confused traders more than it clarified.
Recall that, in annual terms, the number of jobs created outside the agricultural sector came in 79,000 lower than actual figures. On one hand, this is a minor deviation. On the other hand, it is a deviation and, once again, points downward. The market perceived this information positively for the dollar because it expected a much worse outcome. However, -79,000 is hardly a positive figure for the labor market.
The last four months have seen a negative trend in the U.S. labor market. Not only has the number of jobs created consistently fallen, dropping below the "waterline" in July, but prior months' values are also being revised downward. Therefore, the August report may, on one hand, once again show the lowest number of Nonfarm jobs created (in the range of 40,000 to 60,000), and on the other hand, the figures for June and July may be revised even lower.
Traders should remember that Nonfarm Payrolls is not the most accurate indicator of the state of the U.S. labor market, and in fact, there is no truly accurate indicator. Nonfarm Payrolls collects only preliminary hiring data, which can change significantly within a month. And after two months, they may take on an entirely different form. This is precisely why previously published values are constantly being revised. If Friday's Nonfarm report again fails to impress, it will create new problems for the dollar, as the chances for the Federal Reserve to tighten monetary policy in September will diminish even further. We are referring to real chances here, not simply those indicated by the CME FedWatch tool, which many experts often cite.
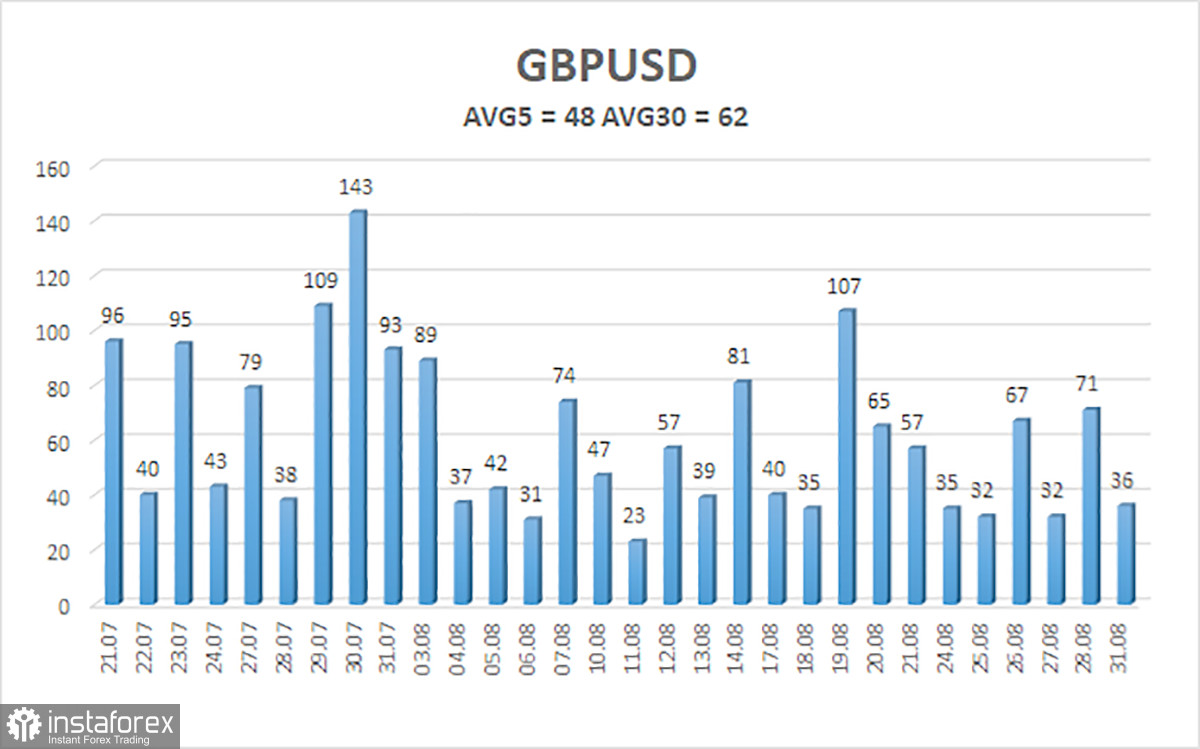
The average volatility of the GBP/USD pair over the last 5 trading days as of September 1 is 48 pips. For the pound/dollar pair, this value is considered "low." On Tuesday, September 1, we expect the pair to move within the range of 1.3493 and 1.3589. The upper channel of the linear regression has turned upward, indicating an upward trend. The CCI indicator has entered oversold territory, signaling a possible end to the correction.
S1 – 1.3489
S2 – 1.3428
S3 – 1.3367
R1 – 1.3550
R2 – 1.3611
R3 – 1.3672
The GBP/USD pair continues to show an upward trend. Donald Trump's policies will continue to exert pressure on the U.S. economy, so we do not expect long-term growth in the U.S. dollar. The year 2026 is looking positive for the dollar due to geopolitical factors, but every story has an end. On the weekly timeframe, the pair remains in a flat range between 1.3150 and 1.3780 within a four-year upward trend, supporting expectations of continued growth in the British currency in the medium term. Long positions with targets of 1.3672 and 1.3733 can be considered when the price is above the moving average. If the price is below the moving average line, trading can be conducted on a decline, with targets at 1.3489 and 1.3428.
Regression channels help determine the current trend. If both are directed in the same direction, it means the trend is currently strong.
The moving average line (settings: 20, 0, smoothed) defines the short-term trend and the direction in which trading should currently be conducted.
Murray levels are target levels for moves and corrections;
Volatility levels (red lines) indicate the likely price channel within which the pair will trade over the next 24 hours, based on current volatility indicators.
The CCI indicator — its entry into the oversold area (below -250) or the overbought area (above +250) indicates that a trend reversal in the opposite direction is approaching.

