
Veja também


 12.10.2026 03:31 PM
US spot Ether ETFs lost $542.1m last week, the worst result since January. Solana funds interrupted a record 14-week inflow streak, and together with outflows from Bitcoin funds three categories shed about $1.25bn. For a market trying to bounce after Bitcoin's recent slide to $80,400, that is an unpleasant backdrop: institutional money is flowing out more broadly than just from the flagship coin.

Ether took the biggest hit. Funds have recorded outflows for nine trading days in a row, since September 29, and $697.2m left over that stretch. This is already the third-longest streak in product history; the record remains 17 days from May 11 to June 3, when about $900.1m left. The week was the second consecutive negative week after a $138m outflow the week before, and category assets fell 10% to $15.71bn. The largest loss fell on BlackRock's ETHA: $477m, roughly 88% of the category's outflow — its biggest weekly withdrawal since mid-December 2025. The heaviest day was Tuesday, when $201.9m left, entirely from ETHA, the day the fund's reverse split (one-for-three) took effect. ETHA's net assets are $8.64bn, roughly $4.15bn less than cumulative inflows of $12.79bn — in other words investors in that fund are currently in the red on aggregate. Year-to-date Ether funds remain up $931.8m, but that figure was $1.47bn a week earlier.
The reversal in Solana is even sharper. Two weeks ago, the funds gathered a record $188.2m in a week; now they lost $24.8m — roughly three times the previous record outflow of $8.9m — and all five sessions finished with withdrawals, the longest outflow streak in the products' history. Bitwise's largest fund, BSOL, lost $20.9m, about 84% of the category's outflow, while only MSOL and QSOL managed combined inflows of $2m. Category assets fell to $1.73bn from a record $1.96bn on September 25. Such a rapid shift from record inflows to record outflows shows how new and sentiment sensitive these products remain.
Bitcoin funds also saw their streak end: $681.1m left over the week, the worst result since the week of June 26, when $1.79bn departed, and three weeks of inflows came to a halt. Almost all the outflow occurred on Wednesday — $487.1m — while on Friday funds returned to inflows of $21.1m. Year-to-date net inflows have fallen to $494.1m from $1.18bn a week earlier; category assets stand at $105.84bn and cumulative inflows since launch total $57.11bn.
The causal chain is clear and macroeconomic. The September Fed minutes showed most participants view another rate increase this year as likely, and US bond yields hit multi-year highs. That hits non-yielding assets, and Ether and Solana behave like riskier versions of Bitcoin, losing faster when investors cut risk. My base case: pressure on Ether funds will persist while yields remain at highs, and the outflow streak may approach the record 17 days. The nearest signal will come on October 14 with US inflation: a weak print would restore risk appetite and stop the outflow, while a strong print would strengthen rate hike bets and open the way to further losses. The first sign of a reversal I will look for is not price appreciation but at least one day of meaningful inflows into ETHA and BSOL, because those two funds drive their categories' dynamics.
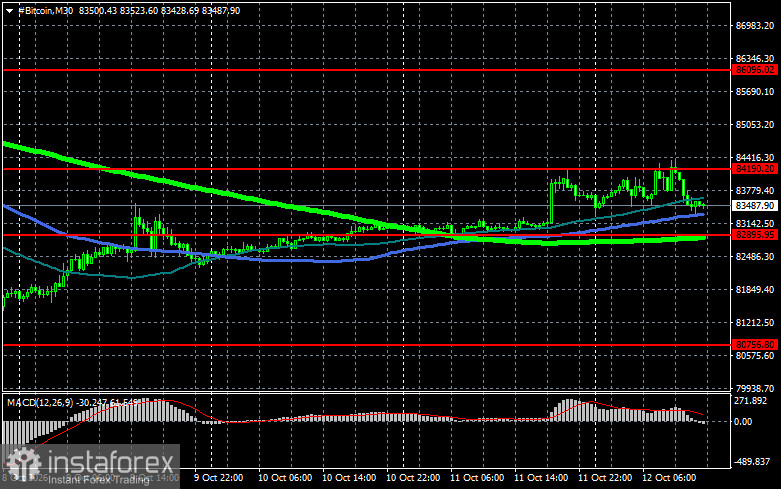
Technical picture for Bitcoin
Buyers are currently targeting a reclaim of $84,100, which would open a direct path to $86,000 and then toward $89,000; breaking $89,000 would signal attempts to restore a bull market. On the downside, buyers are expected at $82,800. A return of the trading instrument below that area could quickly push BTC toward $80,700. The most distant downside target is around $79,400.
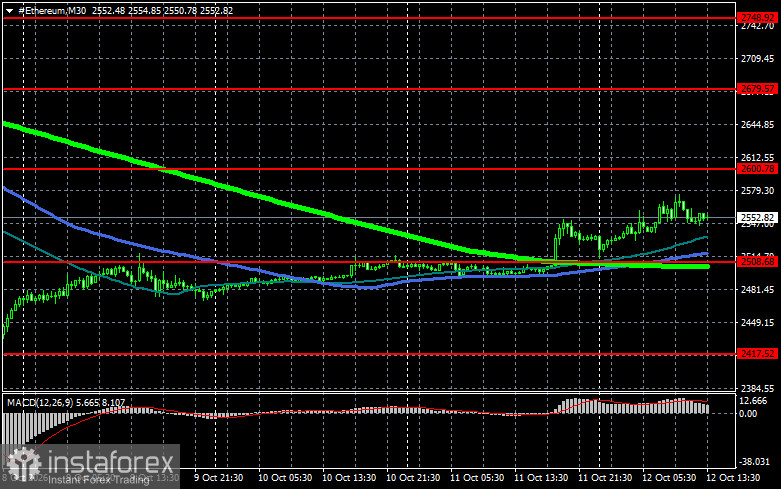
Technical picture for Ethereum
A clear hold above $2,600 would open a direct path to $2,679. The furthest upside target is the high near $2,748; breaking that level would indicate strengthening bullish sentiment and a return of buyer interest. On the downside, buyers are expected at $2,508. A return below that area could quickly push ETH toward $2,417. The most distant downside target would be around $2,348.
What we see on the chart:
- Red lines indicate support and resistance levels where either a price slowdown or active growth is expected;
- Green lines indicate the 50-day moving average;
- Blue lines indicate the 100-day moving average;
- Light green lines indicate the 200-day moving average.
A crossover, or a price test of moving averages, typically either halts the move or sparks fresh market momentum.


